The index to the articles in this series is found here.
So, now that the network is doing as well or better than I can do looking at the same images, it’s time to present this data in a useful format. I decided a simple traffic-light style widget was simplest. Built using tkinter.
This is checked into the git tree under the name deskwidget.py. There’s also an associated configuration file, .rpwidget.conf.
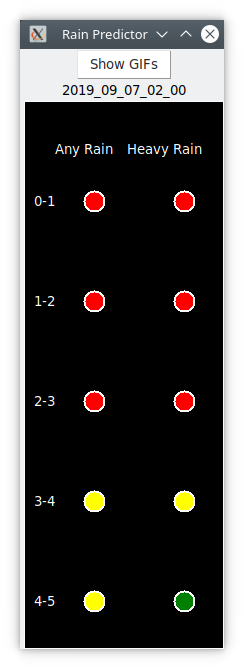
This widget runs by watching the directory into which the downloading script puts its .gif files. When the collection script downloads a file, it also runs the make-rain-inputs.py script to generate the intermediate binary form. This widget polls that directory every second, and when it finds a new run of data files, it feeds them into the trained neural network and gets back confidence numbers for the 10 bits. These are then assigned colours. Green for confidence less than 0.05, red for confidence above 0.95, and yellow in between. A green light in a given time interval indicates that the network is confident that there will be no rain / no heavy rain in that interval. Red indicates that the network is predicting rain in that time interval. Yellow indicates uncertainty. These values are updated every 10 minutes, so an uncertain prediction might become certain a short time later. I can put this traffic signal up on the side of my screen, and then I can tell immediately whether or not to expect rain in the next 5 hours, and roughly when it might begin.
Here is a screenshot of the result:

This widget indicates that it is certain that it will be raining hard in the next 0-1 hours, 1-2 hours, and 2-3 hours. After that, it is uncertain whether or not there will be rain, but by 4-5 hours it is certain that even if there is rain, it won’t be heavy.
There’s also a button that pops up a window with the radar images from which these predictions were made, so that I can second-guess the network if I want to.
The time stamp is the UTC time on which this prediction is based. It should be less than 10 minutes old, but if the radar station goes down for maintenance there are no .gif files for download, and this widget will patiently hold steady until it obtains an hour of good data. The timestamp let’s me see whether the report I’m looking at is stale or not. I think I’ll highlight that, add code so that if the prediction is out of date, the timestamp has a yellow background.